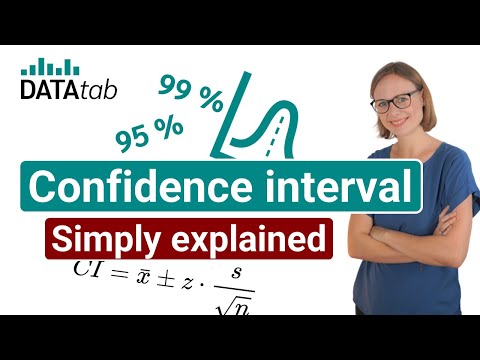
A confidence interval is a range of estimates for an unknown parameter. It is calculated at a certain level of confidence, usually 95%. The range of estimates can be very wide or very small, depending on what you are trying to measure. To use a confidence interval, you need to know the sample size of your data, how you’ll estimate variation, and the levels of significance.
Calculating a confidence interval
Confidence intervals capture the range of a parameter’s variability. For example, if we were studying the amount of time that students spend online, we could calculate the mean over a sample of 100 students and use the margin of error to calculate the confidence level for our results. Similarly, if we were comparing the lifespan of a projector bulb, we could calculate the margin of error using the mean of the bulb lifespan and the standard deviation of the bulb’s lifespan.
The confidence level of a study affects how accurate the estimate is. This is because confidence intervals vary based on sample size. Therefore, when the sample size is greater than 30 individuals, the sample standard deviation should be the same as the population’s standard deviation. Similarly, a confidence interval that is based on a smaller sample size will be larger than one based on a larger sample.
We can use the Finite Population Correction formula to calculate a confidence interval. This formula uses a method called Finite Population Correction (FPC). As a result, the confidence interval indicates how reliable the sample mean is. The wider the confidence interval, the more uncertain the sample mean is. For example, a university’s management might decide that the average height of a batch of students is 170 cm.
The first step in calculating a confidence interval is to determine the sample size. The sample size is important because it affects the margin of error. When the sample size is small, the margin of error is much smaller than if it were large. The standard deviation will vary from one sample to another, so this will influence the margin of error.
Another way to calculate a confidence interval is by using a calculator. It allows you to enter in a sample size, mean, and standard deviation. The calculator will then compute a confidence interval. By entering these three parameters, the calculator will generate a confidence interval that includes the true parameter value.
Confidence intervals can help researchers determine the validity of their data. It’s an important part of inferential statistics and is used in most market research.
Sample size
The standard error and sample size play a critical role in assessing the precision of statistical results. The standard error is the standard deviation divided by the sample size. The larger the sample size, the more precise the results will be. Conversely, a smaller sample size and higher variability will result in a wider confidence interval and a larger margin of error. The width of the interval also depends on the level of confidence the researcher is aiming for. A tight interval around 95% confidence is ideal.
The confidence interval is a way to determine how many samples to collect for a given study. A smaller sample size will result in lower confidence in the results. A 99% confidence interval is equivalent to a margin of error of 1%. In order to get a 99% confidence interval, you need about 16500 samples.
In many situations, the sample size should be more than a few percent of the population. However, in some cases, a sample size of a certain amount can be very small. In such a case, you may have to use a much larger sample. A larger sample size will allow you to be more precise with your estimates.
In order to calculate the confidence interval, you can use a sample size calculator. In most cases, you can simply round up to the next whole integer to get the confidence interval. In opinion polls, the confidence interval is commonly reported as a percentage of the population. For example, a 99% positive result carries a low risk of error, while a 1% negative result carries a high chance of error. By adjusting for these variables, you can determine the accuracy level of your results with greater certainty.
When you perform a survey, a high sample size increases the probability of finding the desired results. This increases the chance that your results are representative of the entire population.
Variation in an estimate
The standard deviation, or s, is a measure of variation in an estimate. The standard deviation is the square root of the variance. This measure can be calculated with the means of the samples and can be used to calculate confidence intervals. It is important to understand that standard deviation is not the same as variance, and that using it to estimate a population’s standard deviation is not necessarily the same thing.
A standard confidence interval contains two standard errors or margins of error. For 95% confidence, these margins are equal to 2 standard errors. A standard error is the standard deviation of the distribution of the sample mean, divided by the sample size. This value is used to determine the statistical significance of an estimate.
A point estimate is the most probable estimate of a population parameter. The margin of error is the amount of uncertainty associated with the sample used to make the estimate. The margin of error is equal to the standard deviation, or the error associated with the sample taken. This margin of error can be affected by sample size, so a larger sample will decrease the margin of error.
A confidence interval is a range of possible population parameter values. It can be either narrow or wide. The smallest confidence interval contains the population mean and is considered the best. A wide confidence interval implies a large margin of error. It is important to understand the limits of a confidence interval and how it can affect a decision.
Variation in an estimate in a confidence range is a critical value that is based on the sample size. If the sample size is too small, the reasoning used for the small sample size is no longer valid. The sampling distribution may not resemble the population’s distribution. It is also important to note that the sample variance may be significantly different from the measurement variance.
A confidence interval may be based on a single estimate, or it can include several different estimates. For example, a large bank may want to estimate the average amount owed by a delinquent debtor. To do this, it randomly samples 100 delinquent accounts. By doing this, it finds that the sample mean owed is 230, with a standard deviation of 90 bpm. The confidence interval for this sample is a 95% confidence interval.
Levels of significance
Confidence interval and levels of significance are used to measure the reliability of statistical results. They are closely related to hypothesis testing. Basically, a confidence interval is the range of values a sample is likely to contain for a population parameter. This type of statistic is important for a variety of reasons, but is mainly used for analyzing large datasets.
The significance of a result is determined by considering its sample size, variation in the population, and sampling error. The result of significance is often expressed as the probability that the result is not due to chance. Generally, a p-value less than 0.05 (5%) is considered significant. It is important to remember that a statistical result can be false if the sample is not representative of the population, and vice versa.
The confidence interval and levels of significance should be considered together. In statistical analyses, the intervals indicate the direction of the effect being studied, making them a useful tool in drawing conclusions. For instance, a positive correlation between a given variable and a lowered blood pressure indicates that the study is statistically significant. A negative correlation, meanwhile, indicates that a negative correlation exists.
The confidence interval is constructed at a chosen confidence level, which is generally 95 percent. It means that if the same population was sampled a number of times, the interval estimates would bracket the true population parameter in approximately 95 percent of cases. It is also possible to think of the confidence level as the opposite of the significance level.
A narrow confidence interval means that the sample size is small. This is not indicative of a small association, but it does mean that a large number of participants are underrepresented. Thus, it is important to report results and confidence intervals whenever possible. In addition, you need to include the lower and upper bounds of the confidence interval.